Posit::Conf 2023
The Viz
Hello all! This week’s TidyTuesday brings us the event schedule from the posit::conf events of 2023 and 2024. Although there isn’t always much in the way of data analysis that we can do with a simple list of conference events, I did find a phenomenon that amused me.
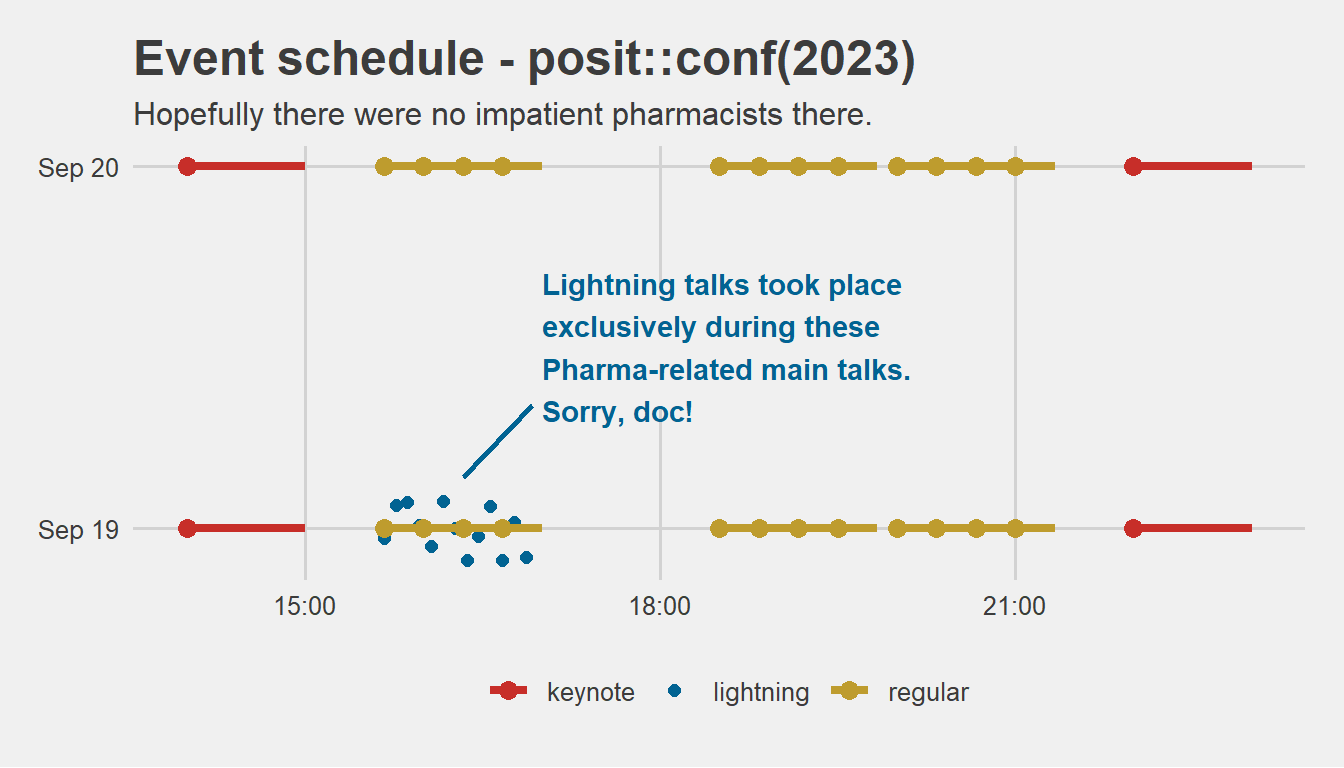
At the conference, there are three types of talks: keynote talks to open and close both days of the conference, regular talks that occur during the day, and very quick lightning talks that cover smaller topics in a very short time window. For some reason, all of the lightning talks were scheduled to overlap with the only pharma-related main talks at the entire event. So people had to choose whether to attend the pharma talks or the lightning talks. I’m not sure what the rationale for scheduling it that was is, but here’s a plot to demonstrate!
Challenges
Although the plot is pretty simple, I used some non-intuitive techniques to place the text and line annotations when the data are dates instead of regular continuous values. I encoded the y axis as a continuous one and used POSIXct objects to place them on the x axis. Feel free to check the code to see how that worked!
Conclusion
As always, thanks for reading! Feel free to reach out to me on LinkedIn if you want to connect or ask questions about my work. See you next week!